Linear Functions and Graphing
More Specific Topics in Linear Functions and Graphing
Popular Tutorials in Linear Functions and Graphing
-
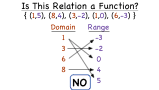
How Can You Tell if a Relation is Not a Function?
Every function is a relation, but not every relation is a function! Watch this video to learn how to tell which relations are functions and which are not.
-
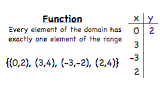
How is a Function Defined?
You can't go through algebra without learning about functions. This tutorial shows you the definition of a function and gives you an example of a function. Take a look!
-
How Do You Find the Slope of a Line from a Graph?
Trying to find the slope of a graphed line? First, identify two points on the line. Then, you could use these points to figure out the slope. In this tutorial, you'll see how to use two points on the line to find the change in 'y' and the change in 'x'. Then, you'll see how to take these values and calculate the slope. Check it out!
-
How Do You Find the X- and Y-Intercepts of a Line If You Have an Equation?
To find the x-intercept of a given linear equation, plug in 0 for 'y' and solve for 'x'. To find the y-intercept, plug 0 in for 'x' and solve for 'y'. In this tutorial, you'll see how to find the x-intercept and the y-intercept for a given linear equation. Check it out!
-
How Do You Write an Equation of a Line in Slope-Intercept Form If You Have Two Points?
Trying to write an equation in slope-intercept form? Have two points on your line? You'll need to find your slope and y-intercept. Watch this tutorial and see what needs to be done to write an equation in slope-intercept form!
-
How Do You Write an Equation of a Line in Slope-Intercept Form If You Have One Point and a Parallel Line?
Want to find the slope-intercept form of a line when you're given a point on that line and another line parallel to that line? Remember, parallel lines have the same slope. If you can find the slope of that parallel line, you'll have the slope of your line! In this tutorial, you'll see how to find the slope of your line and use that slope, along with the given point, to write an equation for the line in slope-intercept form. Take a look!
-
How Do You Write an Equation of a Line in Slope-Intercept Form If You Have One Point and a Perpendicular Line?
Want to find the slope-intercept form of a line when you're given a point on that line and another line perpendicular to that line? Remember, perpendicular lines have slopes that are opposite reciprocals of each other. In this tutorial, you'll see how to find the slope using the slope of the perpendicular line. Then, use this slope and the given point to write an equation for the line in slope-intercept form. Check it out!
-
How Do You Put an Equation in Point-Slope Form Into Standard or Slope-Intercept Form?
Looking for some practice converting the equation of a line into different forms? Then this tutorial was made for you! Follow along as this tutorial shows you how to take a linear equation from point-slope form and convert it into standard form and slope-intercept form.
-
How Do You Find the Slope of a Line from Two Points?
Calculating the slope of a line from two given points? Use the slope formula! This tutorial will show you how!
-
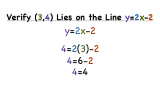
How Do You Check if a Point is on a Line If You Have an Equation?
Wondering if a point is part of the equation of a line? Got the equation of the line but no graph? No problem! Just take that point and plug it into the equation and simplify. If you end up with a true statement, the point is indeed part of the equation. If you end up with a false statement, then that point is not part of the equation. See this process first-hand in this tutorial!
-
How Do You Find the Constant of Variation from a Direct Variation Equation?
The constant of variation is the number that relates two variables that are directly proportional or inversely proportional to one another. Watch this tutorial to see how to find the constant of variation for a direct variation equation. Take a look!
-
How Do You Write an Equation for Direct Variation Given a Point?
Looking for some practice with direct variation? Watch this tutorial, and get that practice! This tutorial shows you how to take given information and turn it into a direct variation equation. Then, see how to use that equation to find the value of one of the variables.
-
How Do You Write an Equation for Direct Variation from a Table?
Looking for some practice with direct variation? Watch this tutorial, and get that practice! This tutorial shows you how to take a table of values and describe the relation using a direct variation equation.
-
How Do You Use a Scatter Plot to Find a Positive Correlation?
Got a bunch of data? Trying to figure out if there is a positive, negative, or no correlation? Draw a scatter plot! This tutorial takes you through the steps of creating a scatter plot, drawing a line-of-fit, and determining the correlation, if any. Take a look!
-
How Do You Use a Scatter Plot to Find a Line of Fit?
A line-of-fit is a line that summarizes the trend in a set of data. In this tutorial, you'll see how to graph data on a coordinate plane and draw a line-of-fit for that data. Check it out!
-
How Do You Use a Scatter Plot to Find a Negative Correlation?
Got a bunch of data? Trying to figure out if there is a positive, negative, or no correlation? Draw a scatter plot! This tutorial takes you through the steps of creating a scatter plot, drawing a line-of-fit, and determining the correlation, if any. Take a look!
-
How Do You Use a Scatter Plot to Find No Correlation?
Got a bunch of data? Trying to figure out if there is a positive, negative, or no correlation? Draw a scatter plot! This tutorial takes you through the steps of creating a scatter plot, drawing a line-of-fit, and determining the correlation, if any. Take a look!
-
How Do You Find the Slope of a Line If You Have a Perpendicular Line?
Perpendicular lines have slopes that are opposite reciprocals of each other. To find the slope of a line that is perpendicular to a given equation, find the opposite reciprocal of that slope. Check out this tutorial to learn how!
-
How Do You Find the Slope of a Ramp If You Know the Rise and Run?
Word problems are a great way to see math in action! This tutorial shows you how to solve a word problem involving rise and run by using the slope formula.
-
How Do You Use X- and Y-Intercepts To Graph a Line In Standard Form?
To find the x-intercept of a given linear equation, simply remove the 'y' and solve for 'x'. To find the y-intercept, remove the 'x' and solve for 'y'. In this tutorial, you'll see how to find the x-intercept and the y-intercept for a given linear equation. Check it out!
-
How Do You Graph a Line If You're Given the Slope and the Intercept?
Trying to graph a line from a given slope and y-intercept? Think you need to find an equation first? Think again! In this tutorial, see how to use that given slope and y-intercept to graph the line.
-
How Do You Write an Equation of a Line in Point-Slope Form If You Have the Slope and One Point?
Trying to write an equation in point-slope form? Got a point on the line and the slope? Plug those values correctly into the point-slope form of a line and you'll have your answer! Watch this tutorial to get all the details!
-
How Do You Write an Equation of a Line in Point-Slope Form If You Have Two Points?
Trying to write an equation in point-slope form? Have two points but no slope? You'll need to use those points to find a slope first. Watch this tutorial and see what needs to be done to write an equation in point-slope form!
-
How Do You Write an Equation of a Line in Slope-Intercept Form If You Have the Slope and the Y-Intercept?
Want to write an equation in slope-intercept form? Already have the slope and y-intercept? Perfect! Just correctly plug those values into your equation and you're done! Learn how in this tutorial.
-
What's the Formula for Slope?
When you're dealing with linear equations, you may be asked to find the slope of a line. That's when knowing the slope formula really comes in handy! Learn the formula to find the slope of a line by watching this tutorial.
-
What's the X-Intercept?
When you have a linear equation, the x-intercept is the point where the graph of the line crosses the x-axis. In this tutorial, learn about the x-intercept. Check it out!
-
How Do You Know if Two Lines are Parallel?
Parallel lines are lines that will go on and on forever without ever intersecting. This is because they have the same slope! If you have two linear equations that have the same slope but different y-intercepts, then those lines are parallel to one another!
-
How Do You Know if Two Lines are Perpendicular?
Perpendicular lines intersect at right angles to one another. To figure out if two equations are perpendicular, take a look at their slopes. The slopes of perpendicular lines are opposite reciprocals of each other. Their product is -1! Watch this tutorial and see how to determine if two equations are perpendicular.
-
What Does the Slope of a Line Mean?
You can't learn about linear equations without learning about slope. The slope of a line is the steepness of the line. There are many ways to think about slope. Slope is the rise over the run, the change in 'y' over the change in 'x', or the gradient of a line. Check out this tutorial to learn about slope!
-
What's the Constant of Variation?
The constant of variation is the number that relates two variables that are directly proportional or inversely proportional to one another. But why is it called the constant of variation? This tutorial answers that question, so take a look!
-
What Does Direct Variation Look Like on a Graph?
Want to know what a direct variation looks like graphically? Basically, it's a straight line that goes through the origin. To get a better picture, check out this tutorial!
-
What's a Scatter Plot?
Scatter plots are really useful for graphically showing a bunch of data. By seeing data graphically, you can see patterns or trends in the data. These patterns help researchers to understand how one thing affects another. This can lead to all kinds of breakthroughs! This tutorial gives you a look at the scatter plot. Check it out!
-
What's Positive Correlation?
Looking at a line-of-fit on a scatter plot? Does that line have a positive slope? If so, your data shows a positive correlation! Learn about positive correlation by watching this tutorial.
-
What's Negative Correlation?
Looking at a line-of-fit on a scatter plot? Does that line have a negative slope? If so, your data shows a negative correlation! Learn about negative correlation by watching this tutorial.
-
What Does it Mean To Have No Correlation?
Scatter plots are very helpful in graphically showing the pattern in a set of data. But sometimes that data shows no correlation. Learn about no correlation and see how to tell if data shows no correlation by watching this tutorial!
-
What Does Negative Slope Mean?
What does a negative slope mean? What does the graph of a negative slope look like? Find the answers to these questions by watching this tutorial!
-
What Are Vertical Lines?
You may be able to guess that vertical lines are lines that go straight up and down, but did you know that all vertical lines have the same slope? In this tutorial, learn all about vertical lines including their slope and what the equation of a vertical line looks like!
-
What Are Horizontal Lines?
Ever look at the horizon when the sun is rising or setting? Know why it's called the horizon? It's a horizontal line! And just like the horizon, horizontal lines go straight left and right. In this tutorial, you'll learn all about horizontal lines including their slope and what the equation of a horizontal line looks like.
-
What Does Positive Slope Mean?
What does a positive slope mean? What does the graph of a positive slope look like? Find the answers to these questions by watching this tutorial!
-
What Does 0 Slope Mean?
A zero slope is just the slope of a horizontal line! The y-coordinate never changes no matter what the x-coordinate is! In this tutorial, learn about the meaning of zero slope.
-
What Does Undefined Slope Mean?
An undefined slope (or an infinitely large slope) is the slope of a vertical line! The x-coordinate never changes no matter what the y-coordinate is! There is no run! In this tutorial, learn about the meaning of undefined slope.
-
What's Point-Slope Form of a Linear Equation?
When you're learning about linear equations, you're bound to run into the point-slope form of a line. This form is quite useful in creating an equation of a line if you're given the slope and a point on the line. Watch this tutorial, and learn about the point-slope form of a line!
-
What's Slope-Intercept Form of a Linear Equation?
When you're learning about linear equations, you're bound to run into the point-slope form of a line. This form is quite useful in creating an equation of a line if you're given the slope and a point on the line. Watch this tutorial, and learn about the point-slope form of a line!
-
What's the Y-Intercept?
When you have a linear equation, the y-intercept is the point where the graph of the line crosses the y-axis. In this tutorial, learn about the y-intercept. Check it out!
-
How Do You Solve a System of Equations by Graphing?
There are many different ways to solve a system of linear equations. In this tutorial, you'll see how to solve a system of linear equations by graphing both lines and finding their intersection. Take a look!
-
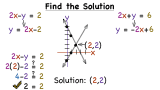
How Do You Solve a System of Equations Using the Substitution Method?
There are many different ways to solve a system of linear equations. In this tutorial, you'll see how to solve a system of linear equations by substituting one equation into the other and solving for the variable. Then, see how to use that variable value to find the value of the other variable. Check it out!
-
How Do You Show that a System of Equations has No Solution?
There are many different ways to solve a system of linear equations. In this tutorial, you'll see how to solve a system of linear equations by graphing both lines and finding their intersection. Take a look!
-
How Do You Solve a System of Inequalities by Graphing?
There are many different ways to solve a system of inequalities. In this tutorial, you'll see how to solve such a system by graphing both inequalities and finding their intersection. Check it out!
-
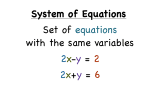
What's a System of Linear Equations?
A system of equations is a set of equations with the same variables. If the equations are all linear, then you have a system of linear equations! To solve a system of equations, you need to figure out the variable values that solve all the equations involved. This tutorial will introduce you to these systems.
-
What's a System of Linear Inequalities?
A system of equations is a set of equations with the same variables. A system of inequalities is almost exactly the same, except you're working with inequalities instead of equations! To solve such a system, you need to find the variable values that will make each inequality true at the same time. This tutorial will introduce you to systems of inequalities.
-
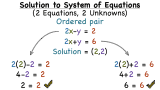
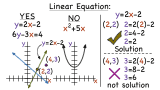
What's a Solution to a System of Linear Equations?
If you have a system of equations that contains two equations with the same two unknown variables, then the solution to that system is the ordered pair that makes both equations true at the same time. Follow along as this tutorial uses an example to explain the solution to a system of equations!
-
How Do You Solve Two Equations with Two Variables?
Trying to solve two equations each with the same two unknown variables? Take one of the equations and solve it for one of the variables. Then plug that into the other equation and solve for the variable. Plug that value into either equation to get the value for the other variable. This tutorial will take you through this process of substitution step-by-step!
-
How Do You Solve a Word Problem Using the Direct Variation Formula?
Word problems allow you to see math in action! Take a look at this word problem involving an object's weight on Earth compared to its weight on the Moon. See how the formula for direct variation plays an important role in finding the solution. Then use that formula to see how much you would weigh on the Moon!
-
What's the Direct Variation or Direct Proportionality Formula?
Ever heard of two things being directly proportional? Well, a good example is speed and distance. The bigger your speed, the farther you'll go over a given time period. So as one variable goes up, the other goes up too, and that's the idea of direct proportionality. But you can express direct proportionality using equations, and that's an important thing to do in algebra. See how to do that in the tutorial!
-
How Do You Use the Formula for Direct Variation?
If two things are directly proportional, you can bet that you'll need to use the formula for direct variation to solve! In this tutorial, you'll see how to use the formula for direct variation to find the constant of variation and then solve for your answer.
-
How Do You Graph an Inequality on the Coordinate Plane?
Graphing inequalities on the coordinate plane is not as difficult as you might think, especially if you know what to do! In this tutorial, you'll see the steps you need to follow to graph an inequality.
-
How Do You Figure Out Whether a Boundary is a Part of the Graph of an Inequality?
Is the boundary part of the graph of an inequality? Here's a hint: the sign of the inequality holds the answer! Learn how to test and see if the boundary is part of the graph of an inequality by watching this tutorial.
-
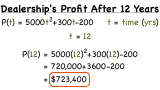
How Do You Solve a Word Problem Using a Function?
Word problems are a great way to see math in action! This word problem deals with calculating profit after a certain number of years. See how to use a function from the word problem to solve!
-
How Do You Solve and Graph Inequalities from a Word Problem?
Word problems are a great way to see the real world applications of math! In this tutorial, you'll see how to graph multiple inequalities to find the solution. Take a look!
-
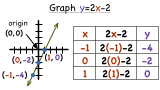
How Do You Graph a Linear Equation?
Graphing a function? It would be really helpful if you had a table of values that fit your equation. You could plot those values on a coordinate plane and connect the point to make your graph. See it all in this tutorial!
-
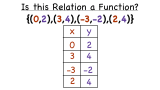
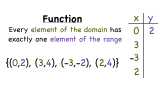
How Do You Figure Out If a Relation is a Function?
How do you figure out if a relation is a function? You could set up the relation as a table of ordered pairs. Then, test to see if each element in the domain is matched with exactly one element in the range. If so, you have a function! Watch this tutorial to see how you can determine if a relation is a function.
-
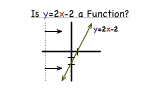
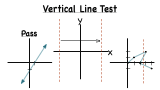
How Do You Use the Vertical Line Test to Figure Out if a Graph is a Function?
Trying to figure out if an equation is a function? Graph it and perform the vertical line test. If it passes, then it's a function! Get some practice by watching this tutorial!
-
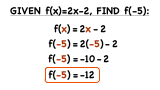
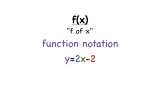
How Do You Find f(x) If You Have a Value For x?
To solve a function for a given value, plug that value into the function and simplify. See this first-hand by watching this tutorial!
-
What's a Function?
You can't go through algebra without learning about functions. This tutorial shows you a great approach to thinking about functions! Learn the definition of a function and see the different ways functions can be represented. Take a look!
-
What's the Vertical Line Test?
Even graphs need to worry about tests! Using the vertical line test, you can figure out if a graph is a function or not. Watch this tutorial and learn about the vertical line test. Then, put your graphs to the test!
-
What is Function Notation?
Every see 'f(x)' in your math? That's function notation! It's a way to indicate that an equation is a function. Learn about function notation by watching this tutorial.
-
What's a Boundary?
If you graph an inequality on the coordinate plane, you end up creating a boundary. This boundary cuts the coordinate plane in half. In this tutorial, you'll learn about this kind of boundary!
-
What's a Half-Plane?
If you graph an inequality on the coordinate plane, you end up creating a boundary that cuts the coordinate plane in half. Each of these halves is called a half-plane. Learn about half-planes by watching this tutorial!
-
How Do You Find the X- and Y-Intercepts of a Line If You Have a Graph?
When you're dealing with graphs, it's often important to identify the x-intercept and y-intercept. In this tutorial, you'll see how to find the x-intercept and y-intercept of a line. Take a look!
-
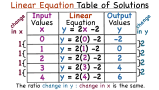
How Do You Make a Table of Values for a Linear Equation?
To graph a linear equation, you could make a table of values to plot, but first you'll need to know how to make the table. Take a look at this tutorial! You'll see how to set up a table, choose appropriate x-values, plug those values into the equation, and simplify to get the respective y-values. This tutorial shows you how to set up a table of values for a linear equation!
-
How Do You Find the Rate of Change Between Two Points on a Graph?
The rate of change is a rate that describes how one quantity changes in relation to another quantity. In this tutorial, practice finding the rate of change using a graph. Check it out!
-
How Do You Find the Rate of Change Between Two Points in a Table?
The rate of change is a rate that describes how one quantity changes in relation to another quantity. This tutorial shows you how to use the information given in a table to find the rate of change between the values in the table. Take a look!
-
How Do You Write the Equation of a Line in Slope-Intercept Form If You Have a Graph?
Working with the graph of a line? Trying to find the equation for that graph? Just pick two points on the line and use them to find the equation. This tutorial shows you how to take two points on the graph of a line and use them to find the slope-intercept form of the line!
-
How Do You Write the Equation of a Line in Slope-Intercept Form If You Have a Table?
Looking at a table of values that represents a linear equation? Want to find that equation? Then check out this tutorial! You'll see how to use values from a table to find the slope-intercept form of the line described in the table.
-
How Do You Use Point-Slope Form to Write an Equation from a Table?
Looking at a table of values that represents a linear equation? Want to find that equation? Then check out this tutorial! You'll see how to use values from a table and the point-slope form of a line to find the slope-intercept form of the line described in the table.
-
How Do You Find the Slope of a Line If You Have a Parallel Line?
Looking at a graph of parallel lines? Got the equation of one of the lines? Want to find the slope of the other line? No problem! Just remember that parallel lines have the same slope! Use the given equation to find the slope of the first line and since the lines are parallel, that's the slope of the second line! To see an example, check out this tutorial.
-
How Do You Determine if an Ordered Pair is a Solution to a Linear Inequality?
To see if an ordered pair is a solution to an inequality, plug it into the inequality and simplify. If you get a true statement, then the ordered pair is a solution to the inequality. If you get a false statement, then the ordered pair is not a solution. Take a look at this tutorial and learn how to determine if an ordered pair is a solution to an inequality!
-
How Do You Make a Scatter Plot?
Scatter plots are a very useful way to help you visually see data. In this tutorial, you'll see how to take data from a table and plot it to create a scatter plot. Take a look!
-
How Do You Write and Use a Prediction Equation?
Scatter plots are a great way to see data visually. They can also help you predict values! Follow along as this tutorial shows you how to draw a line of fit on a scatter plot and find the equation of that line in order to make a prediction based on the data already given!
-
What is a Linear Equation?
If you're learning about graphs, you're bound to see a bunch of linear equations, so it's a good idea to understand what makes an equation a linear equation. This tutorial explains linear equations and shows you the difference between equations that are linear and ones that are not. Check it out!
-
What is Rate of Change?
Trying to describe the how something changes in relation to something else? Use rate of change! In this tutorial, learn about rate of change and see the difference between positive and negative rates of change!
-
What is a Linear Inequality?
A linear inequality is almost the same as a linear equation, except the equals sign is replaced with an inequality symbol. You'll find that a little more effort is needed to solve and graph a linear inequality, but it's nothing you can't handle! Check out this tutorial and get introduced to linear inequalities!